We Analyzed 6 Million Loan Applications. Here’s How Digital Scoring Predicts Default
Discover what 6 million loan applications reveal about how digital credit scores predict repayment behavior and expand access to fair credit.


RiskSeal analyzed over 6 million real loan applications from seven lenders across Mexico to answer a critical question:
Can digital credit scores reliably predict default risk, especially when traditional data is missing?
The findings reveal a clear trend: as digital scores rise, default rates fall. Even among borrowers with little to no credit history.
This is exclusive RiskSeal’s research. It offers a data-driven look at how alternative data is reshaping credit risk assessment.
The context: why Mexico is the perfect test case
Mexico’s consumer lending market is growing fast. It reached $323.4 billion in 2024 and is expected to hit $532.7 billion by 2033.
The country is also a fintech powerhouse. More than 1,100 fintech companies now operate in Mexico, growing about 4% a year.
Their revenues are up 31% year over year, and about 60% focus on underserved consumers with little or no credit history.
This mix makes Mexico the perfect place to test how digital data can fill credit gaps. Here, bureau records are often thin or outdated, leaving lenders with an incomplete picture of risk.
Goal of the research
RiskSeal set out to answer one key question: can digital credit scores reliably predict real-world defaults?
To explore this, we partnered with seven lending institutions: three microfinance companies, three BNPL providers, and one neobank. Together, we scored 6.1 million loan applications.
The goal was to confirm that digital credit scores aren’t just theoretical but reliably predict real-world defaults.
This research was designed to test digital scoring in real lending environments and show how behavioral and device-level data can give lenders a clearer, fairer way to assess risk.
Target audience
This research is for credit risk managers, credit providers, and financial institutions. Especially those looking for better ways to assess borrowers when traditional data is scarce.
It shows how digital signals can strengthen underwriting models, improve portfolio performance, and expand access to credit for underserved consumers.
All results are aggregated and anonymized. No client-specific or personal data is shared.
What the RiskSeal Digital Credit Score is and what it measures
The RiskSeal Digital Credit Score is a country-specific, proprietary model built on insights from over 100 million loan applications.
It’s a real-time risk signal designed to predict repayment behavior at the exact moment of application.
The model evaluates both the number and quality of online services an applicant uses, turning everyday digital activity into a measurable indicator of creditworthiness.
Each applicant receives a score from 0 to 999, with higher numbers signaling lower expected risk.
These ranges help lenders tailor their workflows, tightening controls for the low end and fast-tracking strong applicants.
How RiskSeal score is built
The digital credit scoring model combines over 400 digital signals across key identity dimensions:
- Email: domain quality, account age, breach exposure
- Phone: carrier type, SIM stability, VoIP indicators
- IP & device: proxy, VPN, or TOR usage; device reputation
- Location & timezone: alignment between declared and observed patterns
- Subscriptions & eCommerce activity: presence across verified digital services
- Web registrations & social footprint: signals of consistency and authenticity
- Breach & fraud markers: traces of compromised or synthetic identities
Each factor contributes to the score – negative signals lower it, stable ones lift it.
RiskSeal’s model is fully transparent. All inputs are available via API, so lenders can audit and review the logic behind every score.
Research methodology
The analysis was based on a combined dataset of 6,101,483 consumer loan applications collected from seven lenders.
Each application was scored at the time of submission, using only information available before approval. No post-approval information was used.
Defaults were reported directly by partner institutions and harmonized into a single definition.
Default rates were then calculated per band and checked for a monotonic trend. This was done to check if that risk consistently declined as scores rose.
How we analyzed the data
- Sorted the scores into bands.
We grouped applicants into simple 100-point ranges (0–99, 100–199, … up to 900–999). This step makes the results easy to read and compare.
- Saw where applicants land.
For each band, we measured how many people actually fell into that range. This shows the distribution of the portfolio across the score spectrum.
- Checked the default rate.
Within each band, we calculated what percentage of applicants defaulted. This is the clearest way to link digital score levels with real repayment behavior.
- Confirmed the trend.
We tested whether default rates kept dropping as scores went up – a monotonic decline. This ensures the pattern isn’t just random noise.
- Summarized the results.
Finally, we pulled everything together into high-level metrics that lenders can compare to their own books.
Applicant distribution: where borrowers sit on the spectrum
Before looking at performance, it’s important to see how applicants are spread across the score range. This shows how much each part of the scoring spectrum influences the overall portfolio.

Borrower score distribution
When analyzing more than six million applications, we found that borrowers are not evenly spread. Some score ranges are far more crowded than others.
The table below shows the share of applicants in each 100-point band.
The distribution highlights three broad borrower segments:
Low scores (0–299): 18.2% of all applicants
Borrowers in this range often show weak or inconsistent digital footprints – disposable emails, VoIP numbers, or frequent IP and device changes.
They represent the riskiest segment, where defaults are most likely.
Mid scores (300–599): 57.3% of all applicants
This is the largest group in the dataset.
These borrowers aren’t necessarily high-risk, but many are still stabilizing their financial behavior or recovering from prior credit challenges.
Their digital footprints show partial stability, like regular online activity, active telecom services, etc. But they do not yet have the long-term consistency seen in higher scorers.
High scores (600–999): 24.5% of all applicants
A smaller but clearly distinct segment. These applicants show cohesive, well-established digital identities.
Signals showing this include consistent devices, long-lived email accounts, and engagement with major online services.
Their repayment performance is strong, and defaults are rare.
In summary, most borrowers fall in the mid-range, where lenders face the toughest calls.
The digital score helps pinpoint who is steadily improving versus who may be drifting toward default risk.
.svg)
.webp)
Key finding: higher digital scores mean fewer defaults
To evaluate whether RiskSeal’s digital scores truly correlate with repayment behavior, we calculated the default rate within each score band.
In this analysis, “default” is defined as a payment delay of 90 days or more past due, based on standardized reporting across all partner lenders.
Shorter delays (a missed payment within 30 or 60 days) are treated as delinquencies, not defaults. Our goal was to isolate the most serious and financially relevant credit events.
This approach ensures a consistent, like-for-like comparison across millions of loan records, regardless of product type or lender policy.
The table below summarizes how default rates change as digital scores increase:
The data reveal a clear, monotonic decline in default rates as digital scores increase.
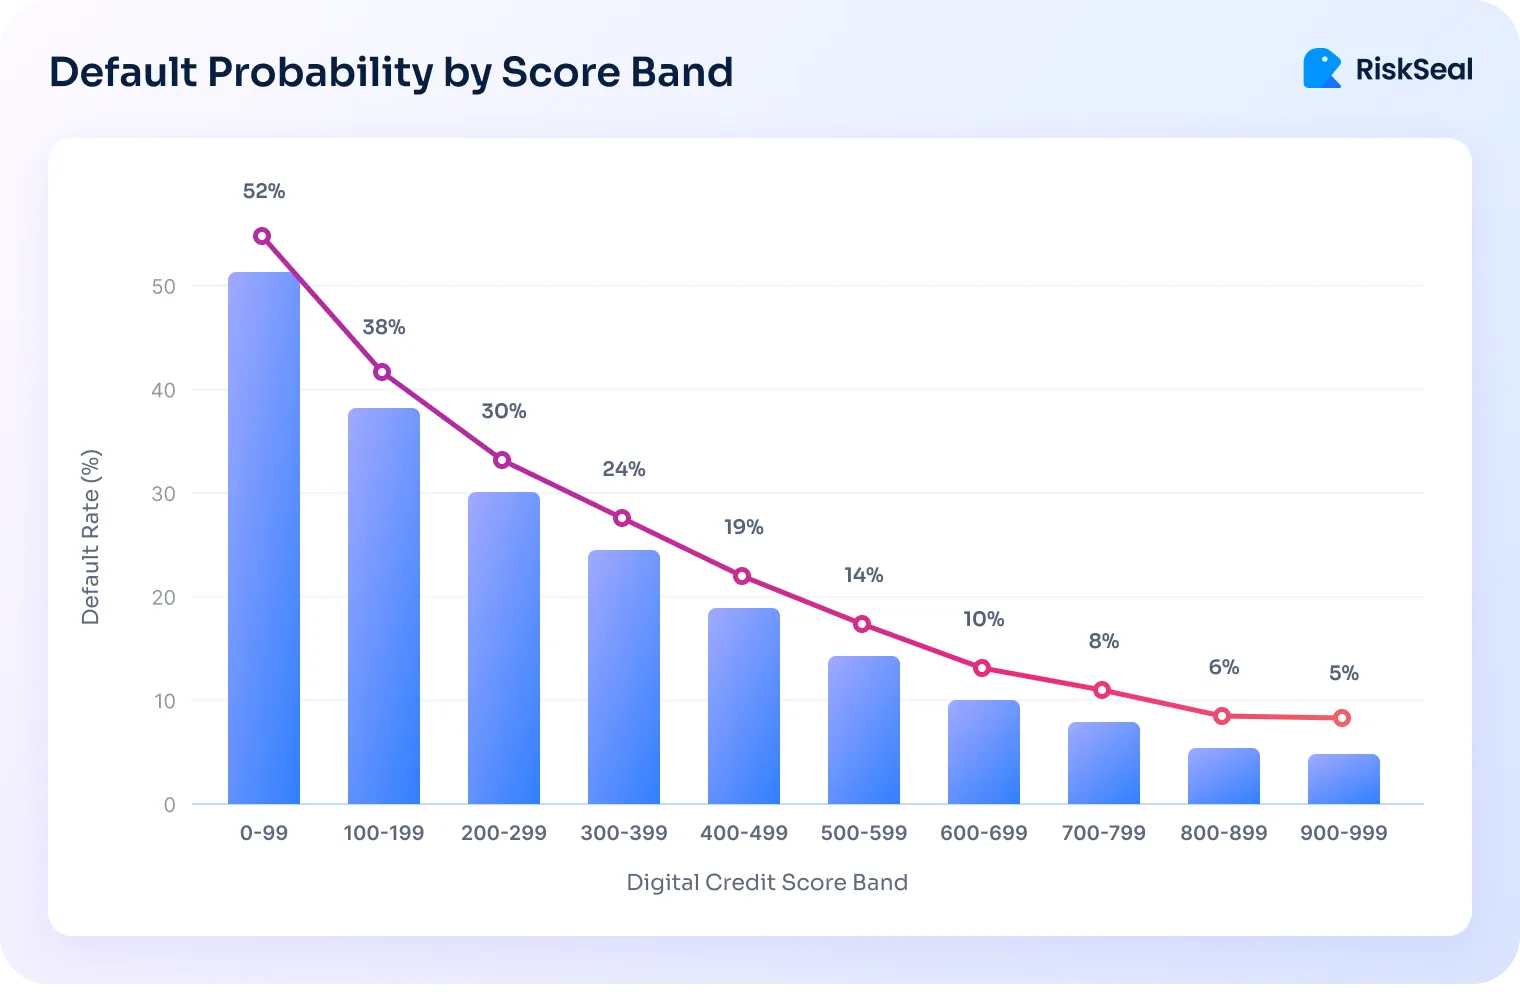
Those in the middle range show gradual improvement. Top scorers – individuals with cohesive, long-standing digital identities – default in fewer than one in ten cases.
This consistency across millions of applications demonstrates the score’s predictive strength and practical reliability for lenders.
Patterns behind the signals
The clear link between digital scores and default rates reflects deeper behavioral and technical patterns.
Borrowers at the bottom of the spectrum tend to show fragmented or unstable digital markers:
- Identity and communication: disposable or recently created email addresses, frequent domain changes, VoIP numbers, and inconsistent personal data across applications.
- Tech and network habits: constantly shifting IPs, VPN or TOR usage, multiple devices tied to one identity, and timezone mismatches across sessions.
- Behavioral activity: frequent failed verifications, limited or erratic eCommerce activity, missing subscriptions, and repeated applications across lenders within short periods.
- Security and risk exposure: indicators linked to chargebacks or fraud, breach-exposed credentials with no recovery activity, and a lack of stable online registrations.
Each of these signals may seem minor on its own. But together, they form a clear pattern of instability and a higher likelihood of default.
At the other end of the spectrum, high digital scorers show stable, consistent patterns across their online and device data.
Their profiles reflect reliability, long-term activity, and low-risk digital behavior:
- Verified identities: long-standing email accounts, stable domains, and consistent personal details across applications.
- Predictable digital habits: steady device and IP usage, minimal use of masking tools, and regular login patterns.
- Engaged online presence: active telecom and subscription services, regular eCommerce activity, and complete, accurate applications.
- Trusted reputation signals: no ties to fraud or chargebacks, secure credentials, and well-established online profiles.
Together, these traits paint a picture of digital maturity and stability.
Borrowers who maintain these patterns demonstrate stronger repayment behavior. And their high digital credit scores reflect that trustworthiness.
Operational implications for lenders
The digital score’s value lies in its ability to turn risk insights into actionable lending decisions.
Instead of applying one policy to all borrowers, lenders can use score bands to tailor workflows, improve risk control, and enhance the customer experience.
In practice, this means:
- Enhanced KYC or manual review for applicants in the 300-499 range to reduce exposure to fraud and borderline-risk cases.
- Fast-tracked approvals for applicants with scores above 800 to speed up onboarding and improve the experience for low-risk borrowers.
- Ongoing monitoring or tighter credit limits for applicants in the mid-bands to manage evolving risk and maintain a healthy portfolio.
This band-specific approach helps lenders balance growth with risk control, improving both efficiency and performance.
Model performance and complementarity with credit bureau data
To measure predictive strength, the final RiskSeal digital scoring model was tested on an independent dataset.
The model achieved an AUC of 0.67, showing stable predictive power in identifying default risk across different lending portfolios.
Even on its own – without traditional credit data – the digital score can reliably separate higher-risk borrowers from lower-risk ones.
When combined with credit bureau information, the model performs even better.
This comparison shows that behavioral and digital footprint data complement traditional credit signals rather than compete with them.
The uplift confirms that RiskSeal’s alternative data adds valuable context to bureau data, improving creditworthiness assessment.
By capturing behavioral and digital patterns that traditional files often miss, the combined approach delivers a more accurate and inclusive view of risk.
Robustness, limitations, and caution
Every model has boundaries. It’s important to recognize where results should be interpreted with caution.
Aggregation caveat
The pooled dataset of 6 million applications provides a strong overall signal. Still, some per-lender variation exists.
Each institution serves different borrower segments and uses different product designs.
For this reason, we recommend that partners run their own validation studies to confirm how the score performs in their specific portfolio.
Default harmonization
For this study, default outcomes from seven lenders were harmonized into a single definition to make pooled analysis possible.
While this process minimizes noise, minor differences in reporting practices may remain. These should not affect the broad pattern but are worth keeping in mind.
External factors
Defaults can shift in absolute terms due to external conditions, from promotional lending campaigns to macroeconomic shocks or seasonal borrowing patterns.
These can temporarily change the level of risk across portfolios. That said, the relative ordering of risk bands remains stable, which is what matters most for decision-making.
Predictive, not causal
Finally, the digital score is a predictive tool.
It identifies correlations between digital footprints and repayment behavior. It does not claim to explain or prove causal mechanisms behind borrower defaults.
Lenders should view it as a powerful predictor, but not a standalone explanation for why people borrow or default.
Practical recommendations
For lenders considering adoption, the following steps provide a clear path to implementation:
- Run a proof-of-concept. Test the score on a recent 5,000-20,000 application sample to measure default rates by band within your portfolio.
- Apply banded operations. Define clear actions for each range - enhanced monitoring, manual reviews, or automated workflows.
- Layer with bureau data. Use the digital score alongside bureau information to strengthen discrimination and enrich existing models.
- Track drift. Monitor band-level default rates over time and recalibrate thresholds monthly during high-volume lending periods.
This checklist ensures that the score is validated and operationalized in a way that adapts to portfolio realities and market shifts.
Conclusion
Across 6 million applications scored at seven Mexican lenders, the RiskSeal Digital Credit Score proved strong and consistent in predicting default risk.
Default rates fell sharply along the score range from 52% in the lowest band (0–99) to just 5% in the highest (900–999).
The evidence is clear: the digital score reliably separates high-risk borrowers from those with solid repayment potential.
But the impact goes beyond accuracy. Digital scoring brings a new layer of visibility. It captures behavioral and financial patterns that reveal real borrower behavior.
This shift matters. It helps lenders reach borrowers who were once invisible to the credit system, while controlling risk with greater precision. This redefines how creditworthiness is measured.
The future of credit isn’t just about more data. It’s about making lending more inclusive for applicants and safer for credit providers.
At RiskSeal, this research marks an important milestone, but not the finish line. We’ll continue deepening our understanding of digital risk signals, refining while expanding to new markets.

The 2026 guide to LATAM digital footprints for credit scoring
Inside the LATAM alternative credit data report


FAQ
See more
.webp)
Learn how digital footprints can enhance credit scoring by utilizing data from social media profiles and website registrations to assess borrower solvency.


Explore how credit stress testing and real-time alternative data empower lenders to spot early warning signs and protect portfolios during the Christmas season.

Discover the power of alternative data in credit scoring to enhance financial inclusion.