The 7 Lending Trends Reshaping Credit Scoring. Insights for Risk Managers
Discover global lending trends that can shape credit scoring strategy for successful financial inclusion.


Borrowers' behavior and creditworthiness vary across different regions of the world.
This needs to be taken into account by credit organizations planning to enter a new market and wanting to adapt their scoring models to it.
In this article, we have compiled global analytics that will advise Heads of Risks and Chief Risk Officers of credit organizations on the brink of expanding their business.
#1. Top Unbanked and Underbanked Populations Globally
Information on the number of unbanked and underbanked people helps to reveal untapped markets for digital lending services and understand the potential for digital footprint analysis.
According to FDIC data, in the United States alone, more than 24 million households do not use banking services or do so insufficiently. This means that 18.6% of the country's population will not be able to qualify for credit based on their credit history.
The situation in the United States is not the most critical. Things are much worse in developing countries with average and low-income levels.
We present the top 15 countries with the highest number of unbanked citizens.
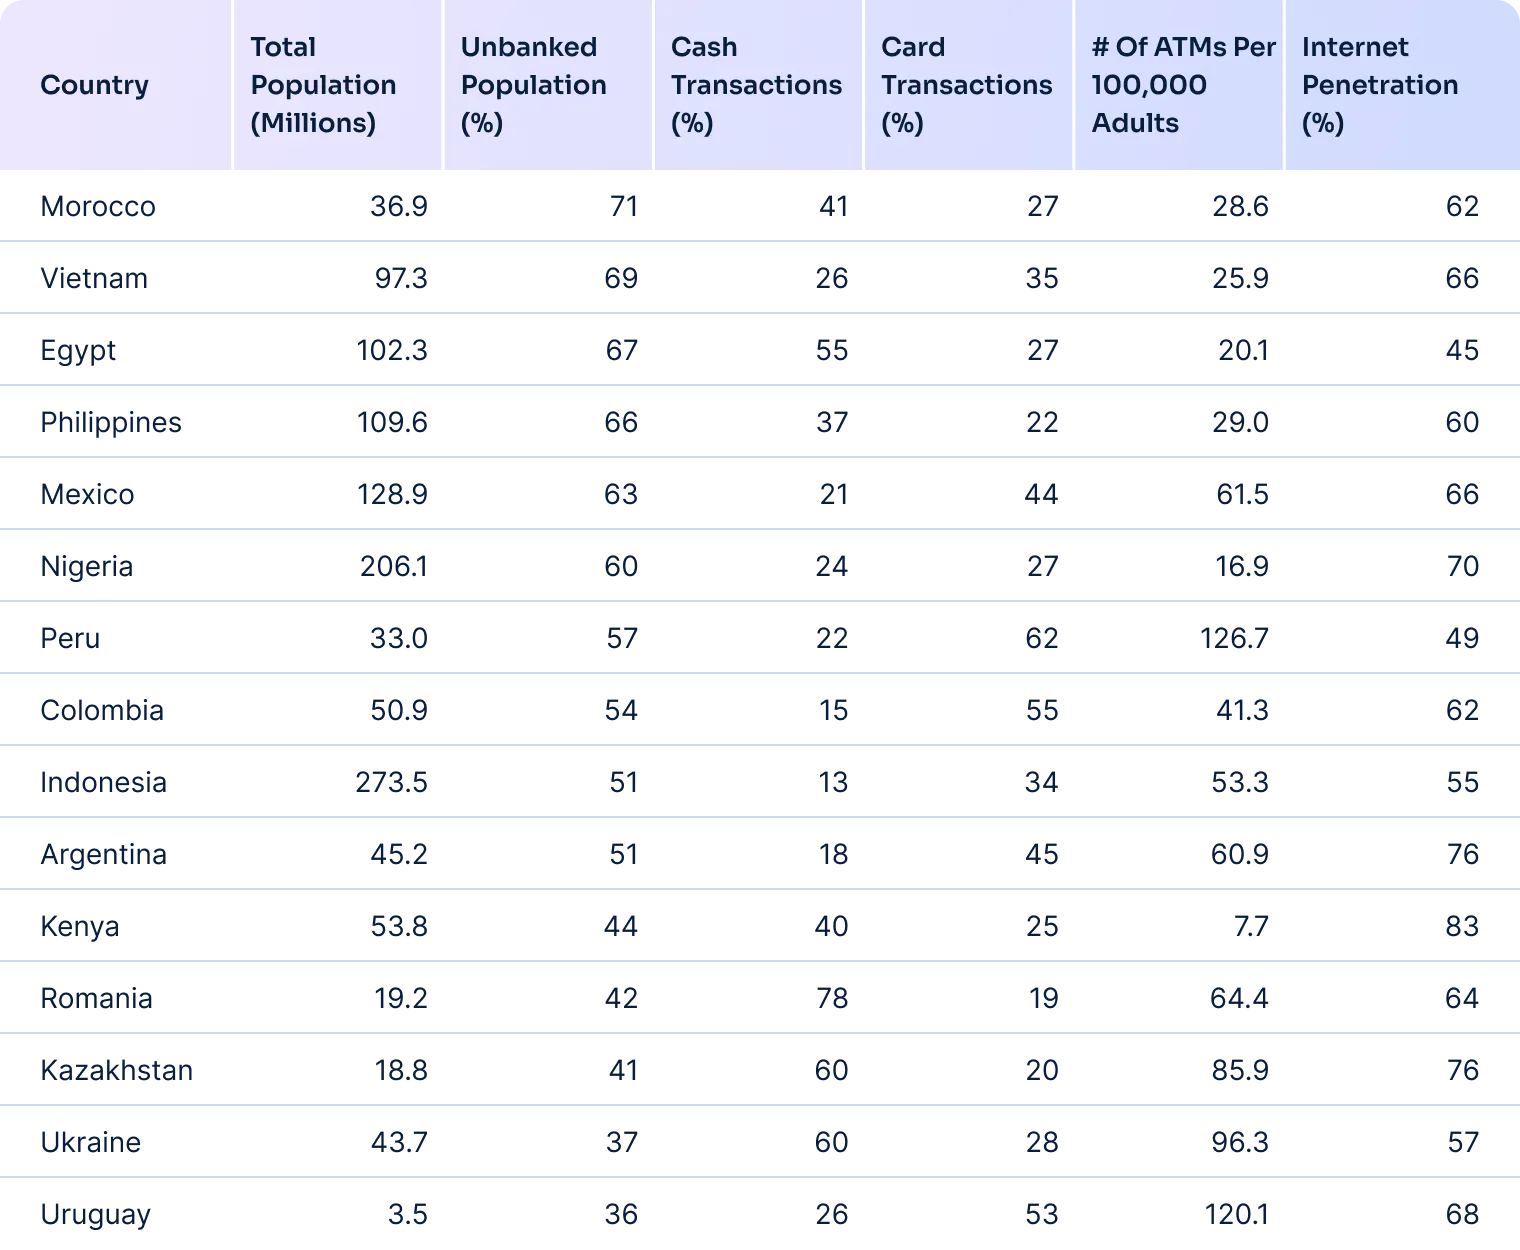
One of the solutions that allows serving these population segments is using alternative data for credit scoring. It helps reach people with no traditional credit history.
Solutions like RiskSeal can assist in penetrating emerging markets and expanding the customer base.
To maximize the effectiveness of digital credit scoring, it is essential to utilize alternative data from multiple sources. This can include consumer activity online, information about utility and rental payments, and mobile phone usage.
After obtaining the data, it is incorporated into the scoring model and used for the borrower's credit assessment.
Take a look at the diagram showing RiskSeal indicators. It illustrates how the model with alternative data provides a much broader population coverage:

#2. Loan Default Rates
In the consumer lending industry, it is crucial to track loan default rates in regions where you plan to conduct business.
Knowing historical data on the number of charged-off unpaid loans supports more accurate credit risk evaluation.
It also helps in calibrating lending models to better predict borrower behavior in different regions.
Let's look at the trends of this indicator in some regions. In 2024, the forecast for default in the USA is expected to rise to 3.5-4.0%, but by 2025, it is anticipated that the figures will be significantly lower, 2.0-3.0%.
Federal Reserve's report on consumer credit says that the level of non-revolving unpaid loans in 2023 amounted to $3.6 trillion while revolving (mainly credit card) loans were at $1.2 trillion.
The report also traces a clear trend of increase in these indicators. Check out the graph below:

The situation varies significantly in Central and Eastern European countries depending on the specific state. Loan default rates in the region range from 0.25% in Estonia to 6.78% in Romania.
You can see data for other countries in the Statista screenshot below:

RiskSeal uses digital footprint analytics to enhance default prevention. The diagram below illustrates RiskSeal's Proof of Concept results for a Spanish digital lending entity:

With an AUC of 0.74, the model’s predictive accuracy is pretty high. This indicates that RiskSeal’s analytics provide a meaningful advantage in identifying potential defaulters.
#3. Unemployment, GDP, and inflation
To improve risk models, it is necessary to consider economic indicators in them, as the unemployment rate and GDP size directly affect the loan default rate. Let's take a closer look at this connection.
First and foremost, it is necessary to trace the relationship between GDP and the unemployment rate.
This can be explained as follows: the production volume depends on the labor employed in its production.
Accordingly, as GDP increases, the unemployment rate decreases.
This is supported by the fact that a decreasing unemployment rate is associated with a growing economy, as shown in the graph below:

The trend is that to increase the number of unemployed by 1%, the GDP must decrease twice as much, that is, by 2%.
The influence of the unemployment default rates is evident. Unemployed borrowers lose the ability to repay loans due to the lack of a steady income.
Based on the above, it is advisable to consider the region's unemployment rate when compiling scoring models.
Here’s a list of countries with the most unemployed population in three regions: Europe, Asia, and South America.
Another factor that influences default rates is inflation. Its level should also be considered in credit scoring models.
According to the International Monetary Fund, global inflation will decrease from 6.8% in 2023 to 5.2% in 2024.
When it comes to measuring inflation, the level of this indicator can vary greatly depending on the region.
In some countries, such as China, Thailand, and Finland, the inflation rate is below 2%.
However, there are states where inflation in 2024 exceeds 200%, namely Zimbabwe and Venezuela.
Check the map for more information on inflation levels in different countries:

#4. Digital Penetration and Mobile Usage Statistics
Analyzing a potential borrower's digital footprint is crucial. This is because the number of consumers using mobile and internet services is much higher than the number of fully banked people.
According to Statista, in 2023, users worldwide spent 60% of their time on the internet using a mobile phone.
The same resource in another study demonstrates media usage in an internet minute:

As you can see, numerous things happen online every minute. Most users trade treasury bonds and send emails and messages on WhatsApp.
Estimate how many potential borrowers without a credit history can be financed, taking into account mobile usage data, if statistically, there are 6+ billion users of mobile operator services worldwide.
Moreover, forecasts suggest that this number will only increase:

The same applies to the internet.
There are billions of consumers from all countries online. The situation by region is as follows:

Solutions like RiskSeal consider all of this data in scoring models, making them very effective in loan default prediction and can help avoid it.

#5. Loan fraud statistics in digital lending
Credit organizations should remember potential vulnerabilities in their systems that fraudsters can exploit.
Fraudulent loan applications are one of the reasons for the rising level of default rates. The scale of the problem is evidenced by the negative trend in the number of consumers with serious financial delinquency, as seen in the graph:

Given the seriousness of the situation, combating fraud is receiving increasing attention.
Statista shows that the global market for fraud detection and prevention exceeded $63 billion in 2023.

Analysis of the digital footprint by RiskSeal is one of the effective methods to combat loan fraud.
We analyze the activity of potential borrowers on dozens of internet resources.
Then, loan prediction using machine learning allows us to recognize atypical user behavior patterns that may indicate fraud.
.svg)
.webp)
#6. Consumer behavior trend - BNPL
Preferences for types of credit and repayment terms can provide valuable insights for tailoring lending products and risk assessment models.
Lending organizations should consider such a consumer behavior trend as a search for convenient payment methods.
The popularity "buy now, pay later" payment method has increased.
A recent survey shows that about 60% of respondents preferred it over credit cards.

#7. Turning to fintech lending instead of traditional banks
This is one of the most common digital lending trends, leading to a constant growth in the number of fintech startups.
According to statistics, the Americas is the region with the highest number of fintech startups globally.
In North, South, Central America, and the Caribbean basin, there are 10,755 of them.
The EMEA region takes second place with 9,323 fintech companies. Also, the Asia-Pacific region is among the leaders with 6,268 such enterprises.

Typically, these organizations use alternative data to reach the consumer segment that traditional scoring models can't assess for credit approval.
Transforming credit scoring models with RiskSeal
RiskSeal offers its clients the opportunity to enhance their credit scoring models through alternative data.
Our services give you access to information that traditional data sources cannot provide.
We offer:
- Over 400 digital signals to create a reliable and effective scoring model.
- Tracking and analysis of borrowers' activity on 200+ internet platforms and social networks.
- Verification of potential clients' subscription services.
- Analysis of the scoring model's performance after enriching it with alternative data.
We help lenders make informed decisions in line with current consumer lending trends.
FAQ
How can global lending analytics benefit risk managers in credit organizations?

Global lending analytics helps risk managers pay attention to lending trends to consider when developing scoring models. These include the unemployment rate in the target region, the country's GDP, recent trends in consumer behavior, and others.
This contributes to risk identification and reduction, portfolio efficiency optimization, and gaining competitive advantages in the market.
What is the correlation between GDP, unemployment rates, and loan default rates?
A country's GDP directly influences unemployment rates, as the production volume depends on the amount of labor engaged in its production. In other words, a decrease in GDP leads to an increase in the unemployment rate.
In turn, a high unemployment rate negatively affects loan default rates. Unemployed individuals cannot repay loans due to the lack of a stable income.
How can the information about loan default rates improve credit models?
Based on data about loan default rates, scoring model developers can accurately forecast future default risk, assess portfolio stability, and identify potential vulnerabilities. Additionally, such information allows for the improvement of credit models.
How can digital footprint analysis extend financial inclusion to untapped markets?
The coverage of the world's population by mobile operators and internet providers significantly exceeds the coverage of consumers by banking services.
Digital footprint analysis allows lenders to finance those borrowers who lack a credit rating to obtain a loan using traditional scoring models.
See more
Explore the top real-time credit risk platforms and learn how faster data improves approvals, reduces fraud, and boosts model performance.


Rethink credit risk to capture growth opportunities traditional scoring leaves behind.
Discover the top-10 APIs bringing predictive power to credit scoring through alternative data.